 Bugzio
Uptime and response time
HTTP checks at the frequency your plan allows — as often as every 30 seconds. Each measurement stores the status code and the response time, so a slowdown is visible before an outage.
Feature
14 services check every project on a schedule, and every check ends in a 0–100 score, an A–F grade and a list of concrete findings. An alert arrives only when the state changes.
No payment card · Unlimited reporters · Interface in 6 languages
Why it matters
A certificate that expired. A page that got twice as slow. A cookie set before consent. None of them send an email.
The result: the client report is ready before the client asks for it.
What you get
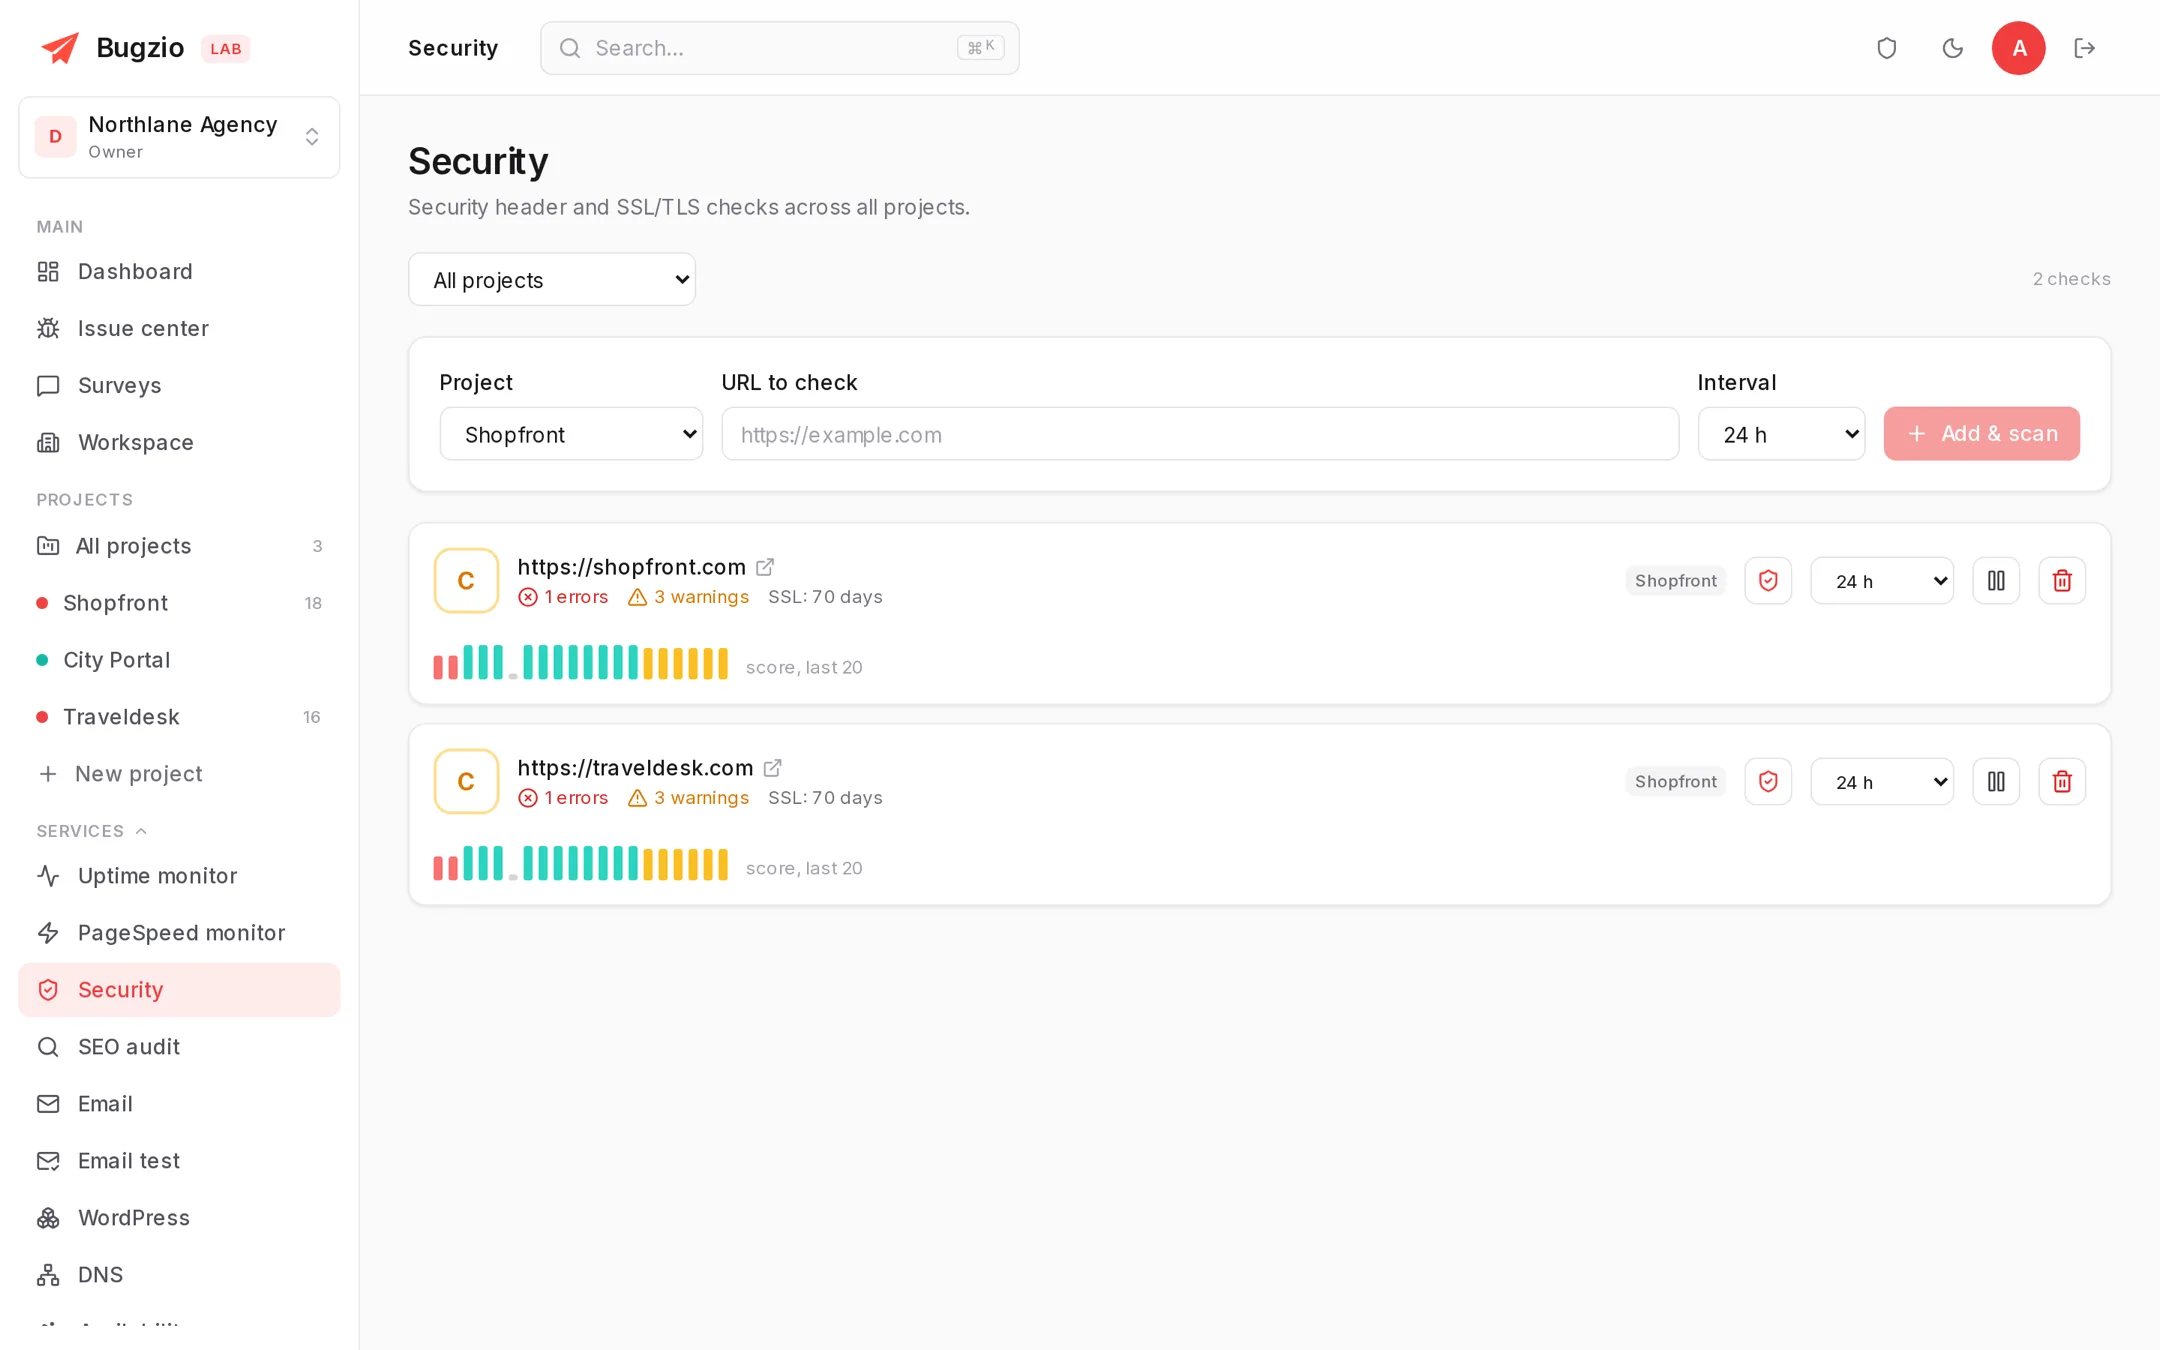
Every service follows the same shape: a score, a grade and findings marked pass, warning or fail.
HTTP checks at the frequency your plan allows — as often as every 30 seconds. Each measurement stores the status code and the response time, so a slowdown is visible before an outage.
Google PageSpeed Insights runs at a plan-defined cadence. The history shows whether the last release made the page faster or slower.
HTTP security headers, cookie flags, CORS, exposed files and panels, certificate configuration, plus a content scan for obfuscated code and unexpected redirects.
Titles, meta descriptions, the canonical URL, indexability, social tags, image alt coverage, robots.txt and sitemap.xml.
A WCAG 2.2 AA audit with axe-core across several viewports, and a GDPR scan that records cookies and trackers set before consent is given.
An alert goes out only when a service moves from a good state to a bad one, and once more when the problem is resolved — not on every check. Delivery is set up with us: email, and SMS on request.
More than 48,000 automated checks have run so far, 44,414 of them uptime checks. It is the same system that will run on your projects.
A grade, a score and findings per service. A finding points at the specific place, not at a generic recommendation.
How it works
The services live in the project settings. Switch on what you need; the rest happens in the background.
An address and a domain. The check targets for each service are created from them.
Per project. The plan decides how often the checks run and how long the history is kept.
By email, with SMS on request; we set the recipient up with you. The full history stays in the panel, so a client report can be produced at any moment.
The full list
Each of them can be switched on separately, per project.
Related features
Each of these adds a layer to the same record, so the panel keeps one report per bug, not one per feature.
A widget that captures the screenshot, the console, network requests and the environment in one click.
A consent banner with a log you can show as proof, and automatic script blocking on WordPress.
Your logo, your colour, your domain and a separate workspace for every client.
Turn monitoring on for one project and see what the 14 services find on your site today.
No payment card · Unlimited reporters · Interface in 6 languages